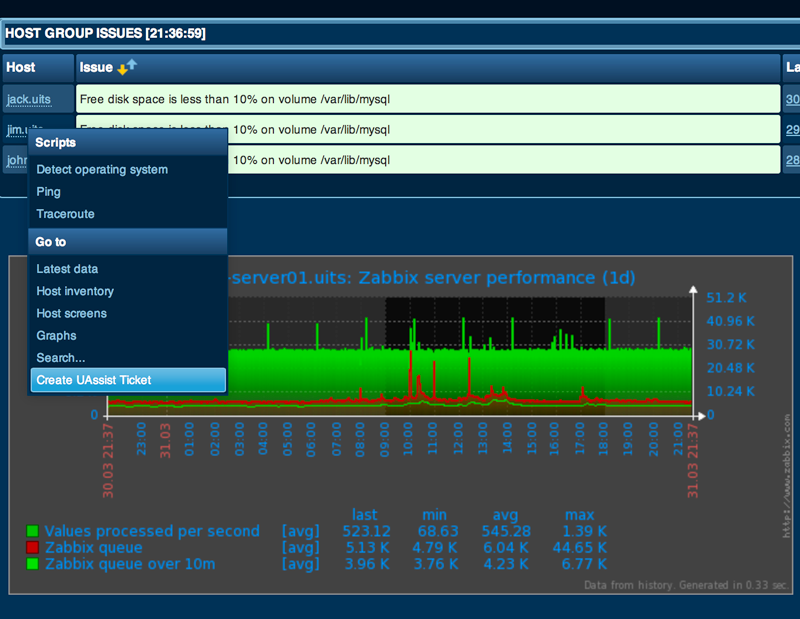
Zabbix is an open source Enterprise Monitoring solution. It gathers information about servers and network devices, and alerts operations staff to problems that arise.
Implementing and running Zabbix for UITS was a big challenge. UITS monitors over 3000 different servers, network equipment, electrical, environmental, and vendor appliances. Just getting the basics of those devices imported and discovered took the better part of six months. Once the basics were in place, the fun began.
Gathering the data really turns out to be the easy part. The difficult part in data analysis is usually in asking the correct question. Developing use cases, and asking the right questions was critical to the on-going success of this project. With the right questions in hand, gathering, displaying, and alerting on the data flowed easily.
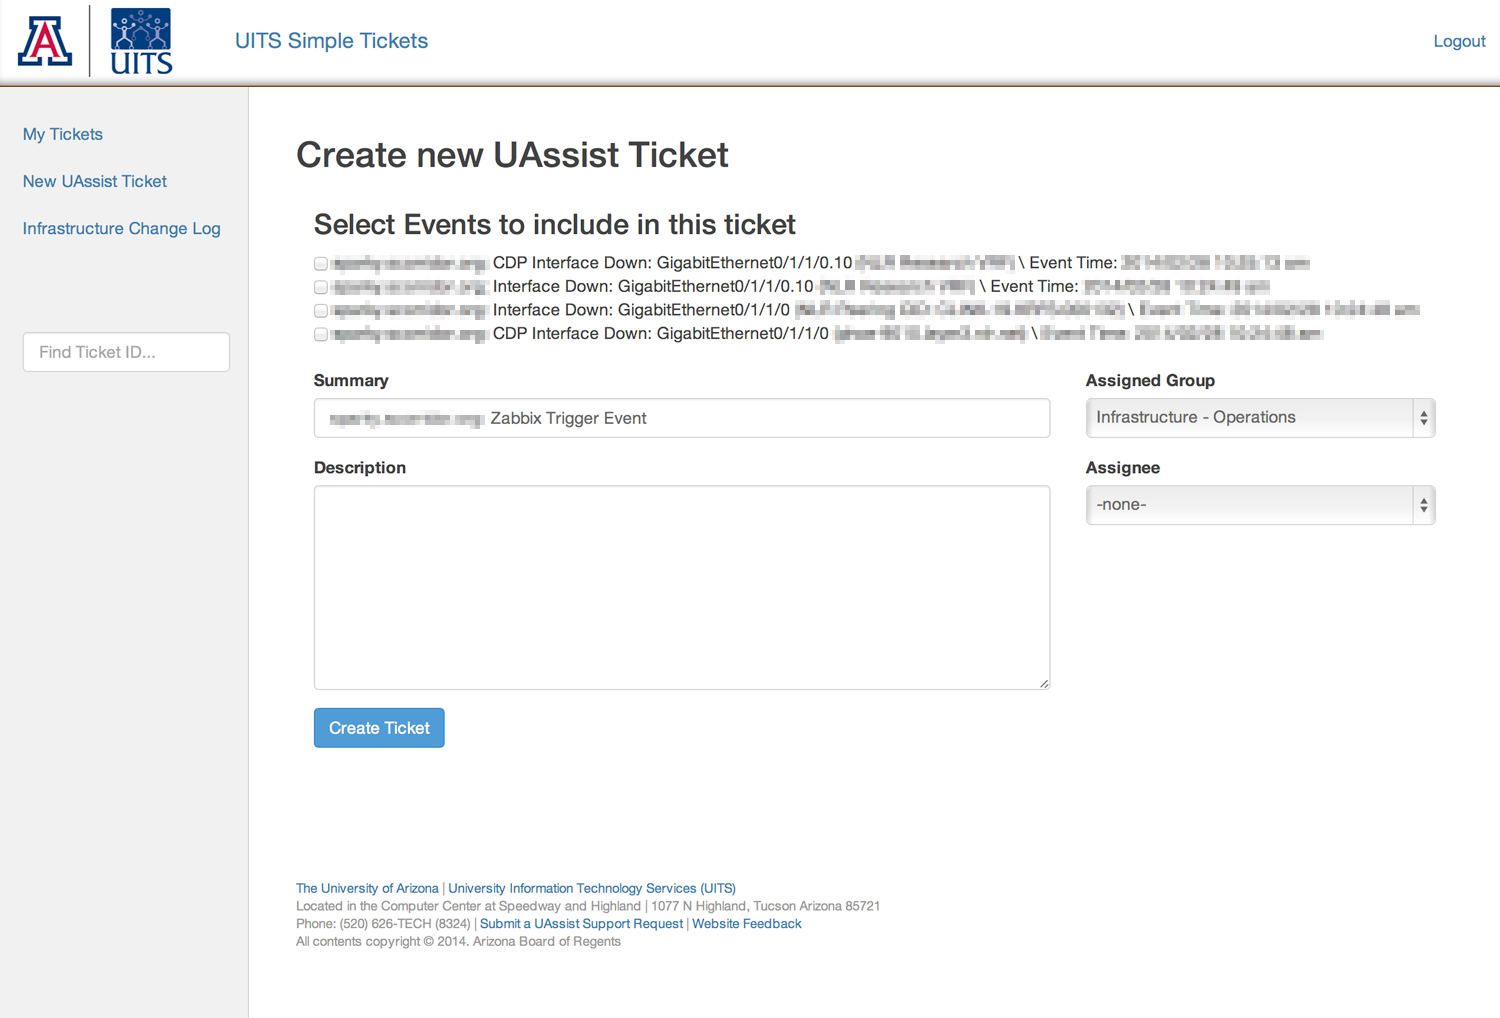
Because of its open source nature, Zabbix is very expandable. There was never a case where the data we sought could not be imported into Zabbix. Often this required writing customized code to interface with a particular bit of software or application. I wrote these custom collector programs in a variety of languages: Perl, C, Python, C#, PowerShell, PHP, and shell script.
Zabbix is a treasure trove of data, and getting that data out in the right fashion was also a project in itself. Data can be displayed directly within the Zabbix web interface, but it also contains a powerful REST API that allows data to be pulled out for use in customized dashboards, as well as other applications.